In the first half of the project, WP3 activities Act 3.1 and Act 3.2 are completed and now being used in other RESPONSe WPs. While Act 3.1 is focused on the analysis of the observed climate change in the atmosphere and Adriatic Sea, Act 3.2 is focused on the climate change projections’ analysis. This led to one report in Act 3.1 and two reports & two dataset deliverables in Act 3.2.
Concerning the observed climate change, deliverable 3.1 provided a standard climate analysis of several temperature and precipitation based indices from local observations and E-OBS gridded dataset, supported by the advanced climate analysis related to
(1) estimation of climate index for tourism (CIT; based on the ERA5 reanalysis),
(2) heating and cooling days (based on the E-OBS dataset),
(3) GEV analysis of extreme daily precipitation (based on the E-OBS dataset) and
(4) trend analysis of the wind gusts at 10m (based on the ERA5 reanalysis).
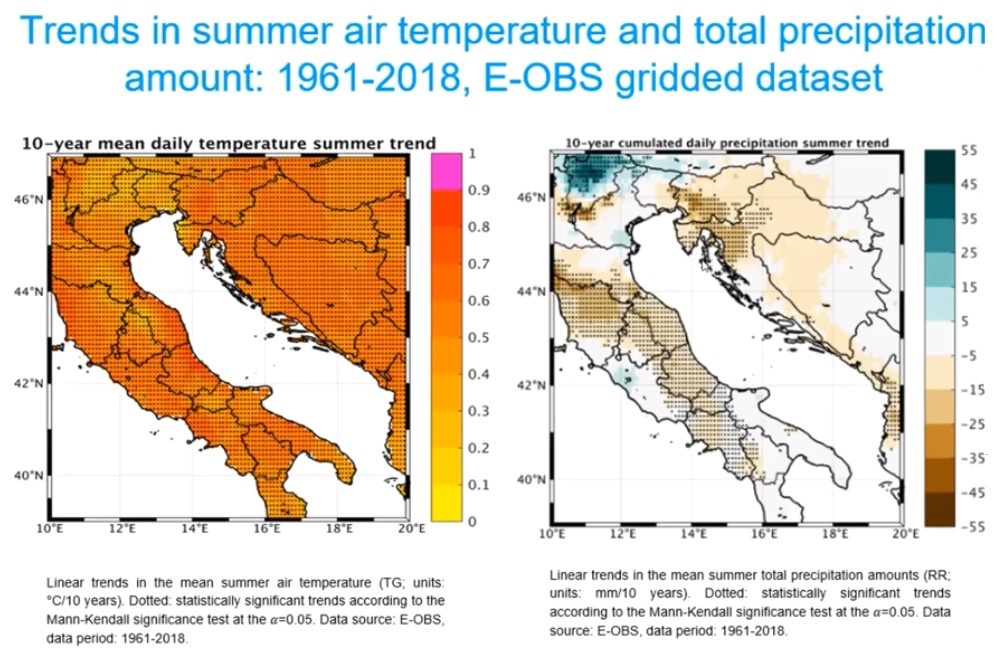
Results show that temperature trends during the period 1961-2018 for majority of the temperature related variables and indices are positive and statistically significant over most of the region and in all seasons. In parallel, linear trends in terms of the precipitation amounts show large variability in terms of the sign (both positive and negative trends are documented) and their amplitudes are rarely statistically significant. Seasonal decomposition of mean monthly sea surface temperature (SST), showed 2 periods at all stations: a cooling trend prior to 1979 and substantial warming after 1979, particularly intensified since 2008, with trends as high as 1.56 °C /decade.
Limitations of all datasets are clearly communicated. For example, the values from the E-OBS dataset represent mean values over its grid (approx. 12.5 km x 12.5 km in the E-OBS 19.0), which leads to e.g. precipitation underestimation in E-OBS when compared to actual extreme precipitation events observed at the local stations (when available). The need for the high quality and long term atmospheric and ocean station observation is occasionally in conflict with sparse networks, the jumps in the observational technology applied and limited data access. These issues will be additional addressed in the Act. 3.3 deliverables in the second half of the project.
Concerning the future climate, partners provided an analysis of 3 EURO-CORDEX regional climate models, forced by the 4 CMIP5 global climate models under 2 RCP greenhouse gases concentration scenarios, with a focus on atmospheric variables such as near-surface air temperature and total precipitation. Additional analysis of one Med-CORDEX ocean climate model performed, with a focus on ocean/sea variables such as sea surface temperature, sea surface salinity and sea level height. Changes in a near-future climate (P1 (2011 – 2040)) and mid future climate (P2 (2041 – 2070)) with respect to historical climate (P0 (1971 – 2000)) were analysed and compared for two RCP scenarios (RCP4.5 and RCP8.5). In addition, systematic errors of regional climate models and the description of the bias correction/adjustment method was analysed under D.3.2.3. In D.3.2.3 systematic errors of the regional climate models and the description of the bias correction/adjustment method were analysed and supported by the dataset D.3.2.4 that includes extracted and bias corrected/adjusted time-series of mean, minimum and maximum daily near-surface (2 m) air temperature and total precipitation amount also for the locations of the RESPONSe target areas. These bias corrected time-series are now being used in the creation of so-called climate factsheets that provide concise summary of the project climate change results over the project target areas.
Both scenarios analysed (RCP 4.5 and RCP 8.5) show an increase with an average between 0.6 °C and 0.8 °C for the sea surface temperature in the near future, while for the mid future (2041 - 2070) is expected between 1.1 °C and 1.3 °C for the RC4.5, and between 1.6 °C and 2.0 °C for the RCP8.5. Sea surface salinity (SSS) is expected to gradually increase in both, RCP4.5 and RCP8.5 scenario, with higher increase in coastal areas that are majorly influenced by the local rivers. In the atmosphere, climate change projections show intensification of the already present warming trends in all seasons, while changes in the hydrological cycle are more pronounced from the mid-21st century onwards, with summer drying tendency reaching up to -20% over parts of the domain.
To go deeper, please read the following project deliverables:
Deliverable 3.1 Climate change assessment: observation base study
Deliverables 3.2 and 3.4 Time series of RCMs & time series of bias adjusted RCM simulations extracted for the project target regions and locations